02 · Real-time operations dashboard
Kitchen Ops
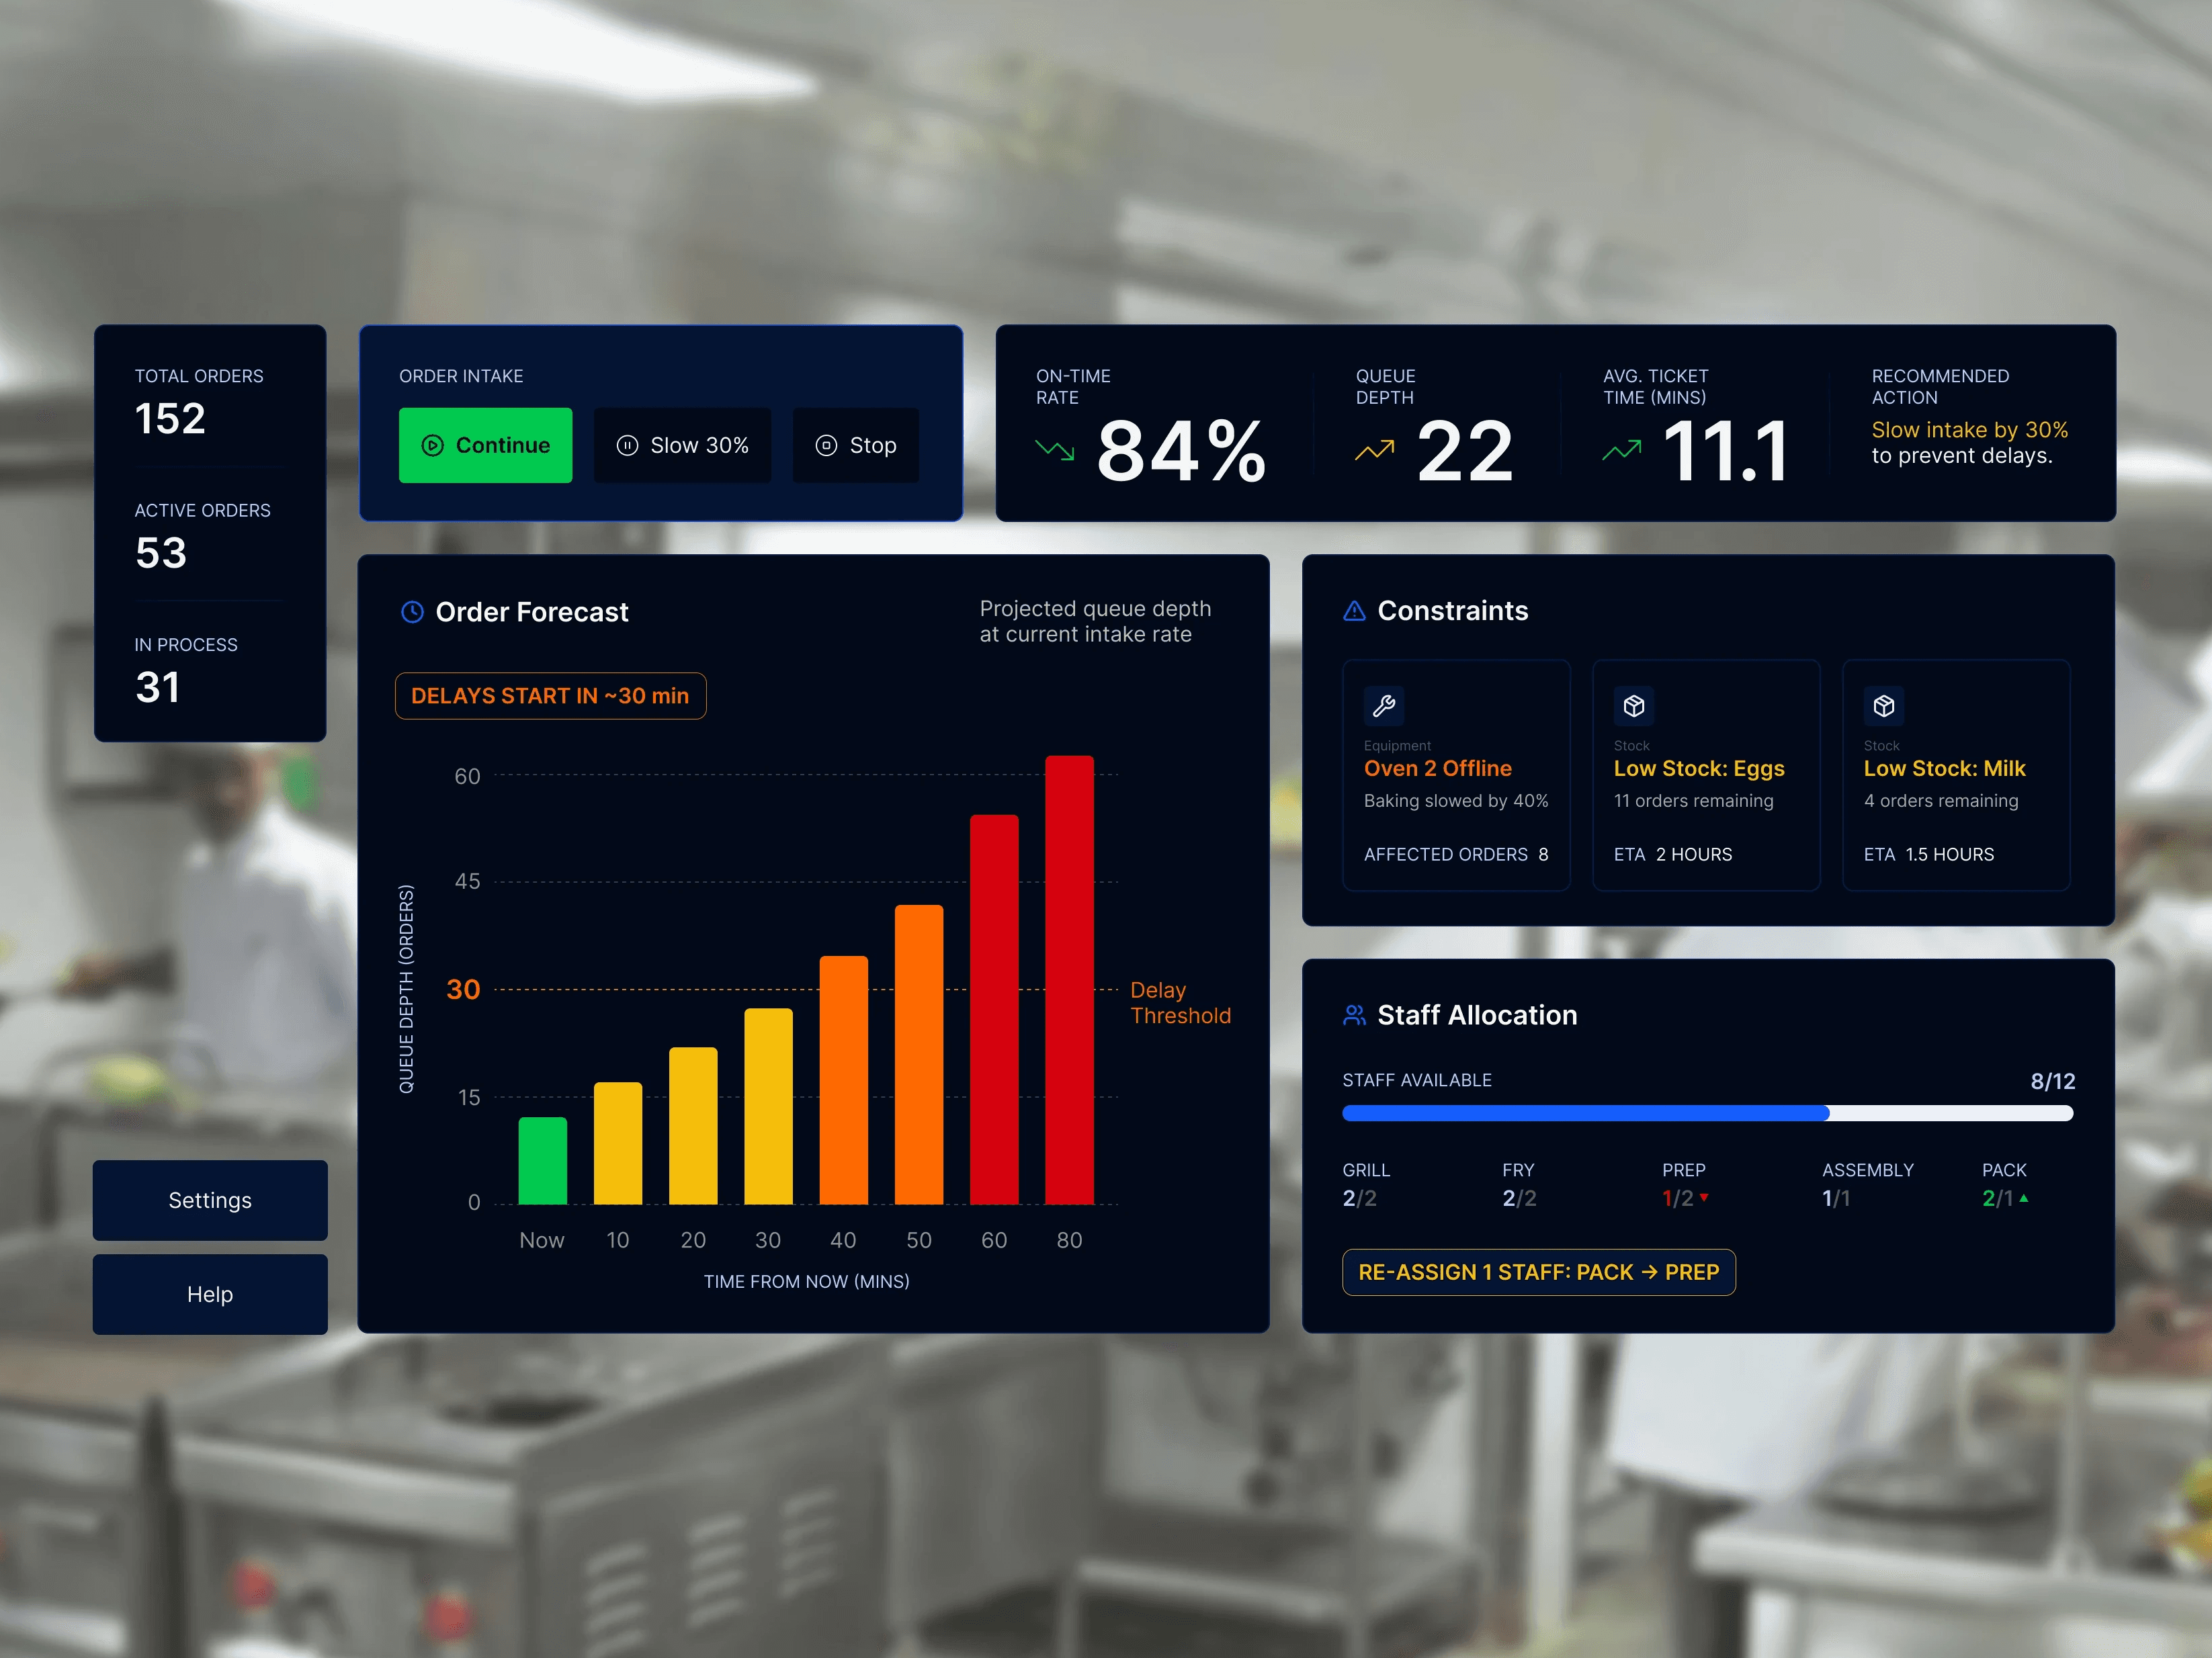
A real-time operations dashboard for cloud kitchens: a central control screen that helps kitchen teams quickly read current workload, performance and risk, especially during busy service.
- Year
- 2026
- Type
- Academic project
- Role
- Dashboard design
Challenge
During peak hours, cloud kitchen operators rely on fragmented systems. That leads to delays, bottlenecks and reactive decisions instead of proactive control.
Research
I mapped the kitchen’s systems, information flow and repeated interactions to understand how operators decide whether to keep accepting orders during peak hours.
- 01
Access points
Fragmented systems increase mental workload.
- Orders
- Delivery
- Kitchen displays
- Attendance
- Inventory
- Messages, calls and printed slips fill the gaps.
- Cooks, supervisors and delivery partners become information sources.
- 02
Touch points
Pressure builds before operators pause intake.
- Order spikes
- Queue growth
- Delivery warnings
- Decision anxiety
- Verbal escalations and staff changes compete with screen alerts.
- 03
Information flow
The manager must combine scattered signals to decide intake.
- Delivery platforms
- Management screen
- Kitchen display
- Preparation
- Deadlines are tracked separately.
- Congestion, complaints and pickup delays arrive from different places.
- 04
Information architecture
Six groups need to be readable together.
- Intake status
- Order load
- Time pressure
- Capacity
- Constraints
- Reference
- Bring waiting orders, deadlines and staff into one view.
- Connect station workload, equipment, ingredients and pickups.
- 05
Navigation flow
Move from status to an actionable intake decision.
- Status & trends
- Time & staffing
- Bottlenecks
- Risk assessment
- Continue
- Slow
- Stop
- Check constraints and whether the risk can be resolved.
- 06
Sitemap
Overview is the entry point, not another screen to search.
- Overview
- Load / time / capacity
- Details & history
- Pair intake status and overall risk with the primary action.
- Keep timelines, performance, pause decisions and alerts available as reference.
- 07
Interaction audit
Overload is difficult to detect early.
- Words
- Displays
- Objects
- Space
- Time
- Behaviour
- Warnings, queues, touchscreens and printed slips compete.
- Screen switching, station visits and repeated questions slow monitoring.
- 08
Repetitive interactions
Seven recurring tasks define the daily loop.
- Order load
- Prep speed
- Deadlines
- Resources
- Alerts
- Kitchen scan
- Intake decision
- 09
Design principle evaluation
Intake decisions were weakest in visibility and recovery.
- Visibility
- Feedback
- Consistency
- Affordance
- Learnability
- Control
- Simplicity
- Accessibility
- Recovery
- Deadline monitoring lacked control.
- Alert handling lacked consistency.
- Clearer signals and actionable feedback became priorities.
Ideation
Bring order load, cooking speed, staff availability and delay risk into one decision-focused dashboard, so operators can act earlier and with less stress.
Heuristic evaluation
- 01
What works
One screen supports quick, informed action.
- Real-time status, familiar language and consistent labels.
- Direct intake controls preserve freedom and reduce recall.
- Quick actions and adjustable settings support efficiency.
- Secondary details stay out of the main view.
- 02
What needs care
Guidance helps, but judgement still belongs to the operator.
- Warnings prevent errors without blocking risky decisions.
- Suggested corrections help users recognise problems.
- Recovery still relies on the operator’s judgement.
- Inline guidance suits trained users; dedicated help remains limited.
Components
- 01
Digital
Make the current state and next action clear.
- Intake action
- Status
- Information panels
- Risk
- Progress
- Navigation
- Normal / slow toggle
- A primary intake action anchors the screen.
- Load and time indicators surface pressure; expandable navigation reveals details.
- 02
Behavioural
Close the loop between decisions and feedback.
- Early warning
- Guided suggestion
- Intake change
- Confirmation
- Alerts expose rising risk.
- Suggestions recommend slowing or pausing before overload and late delivery.
Solution
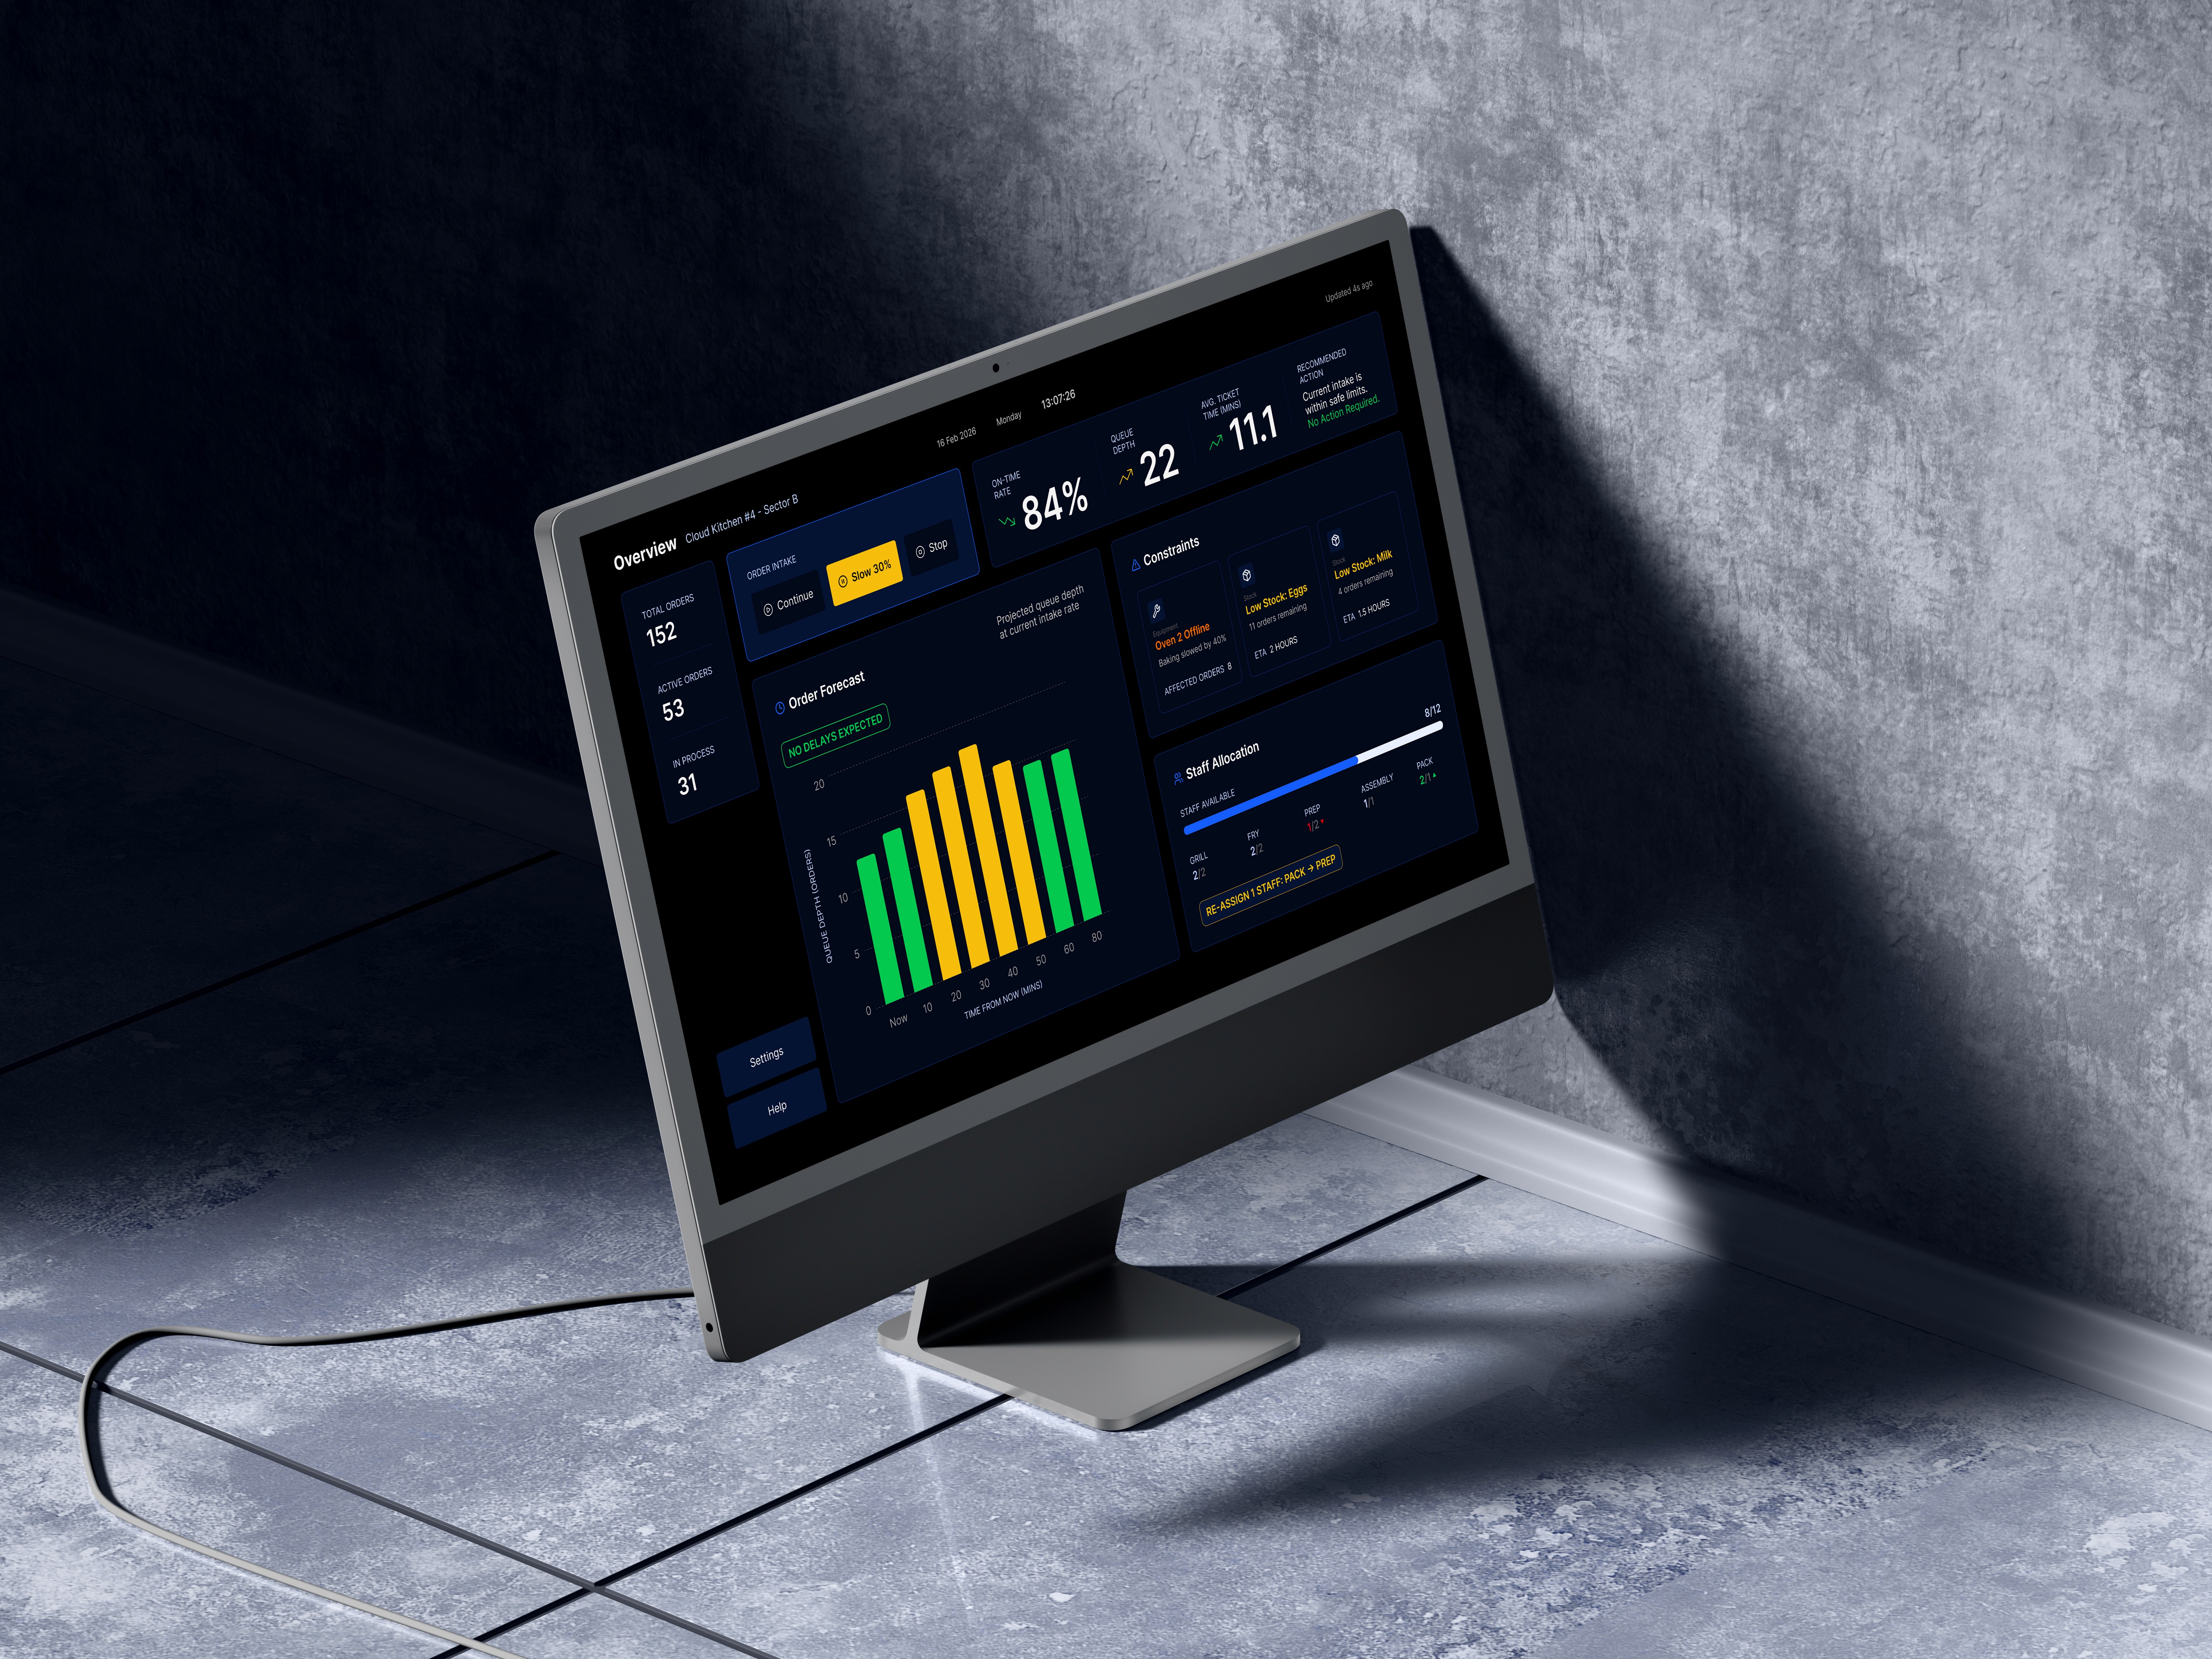
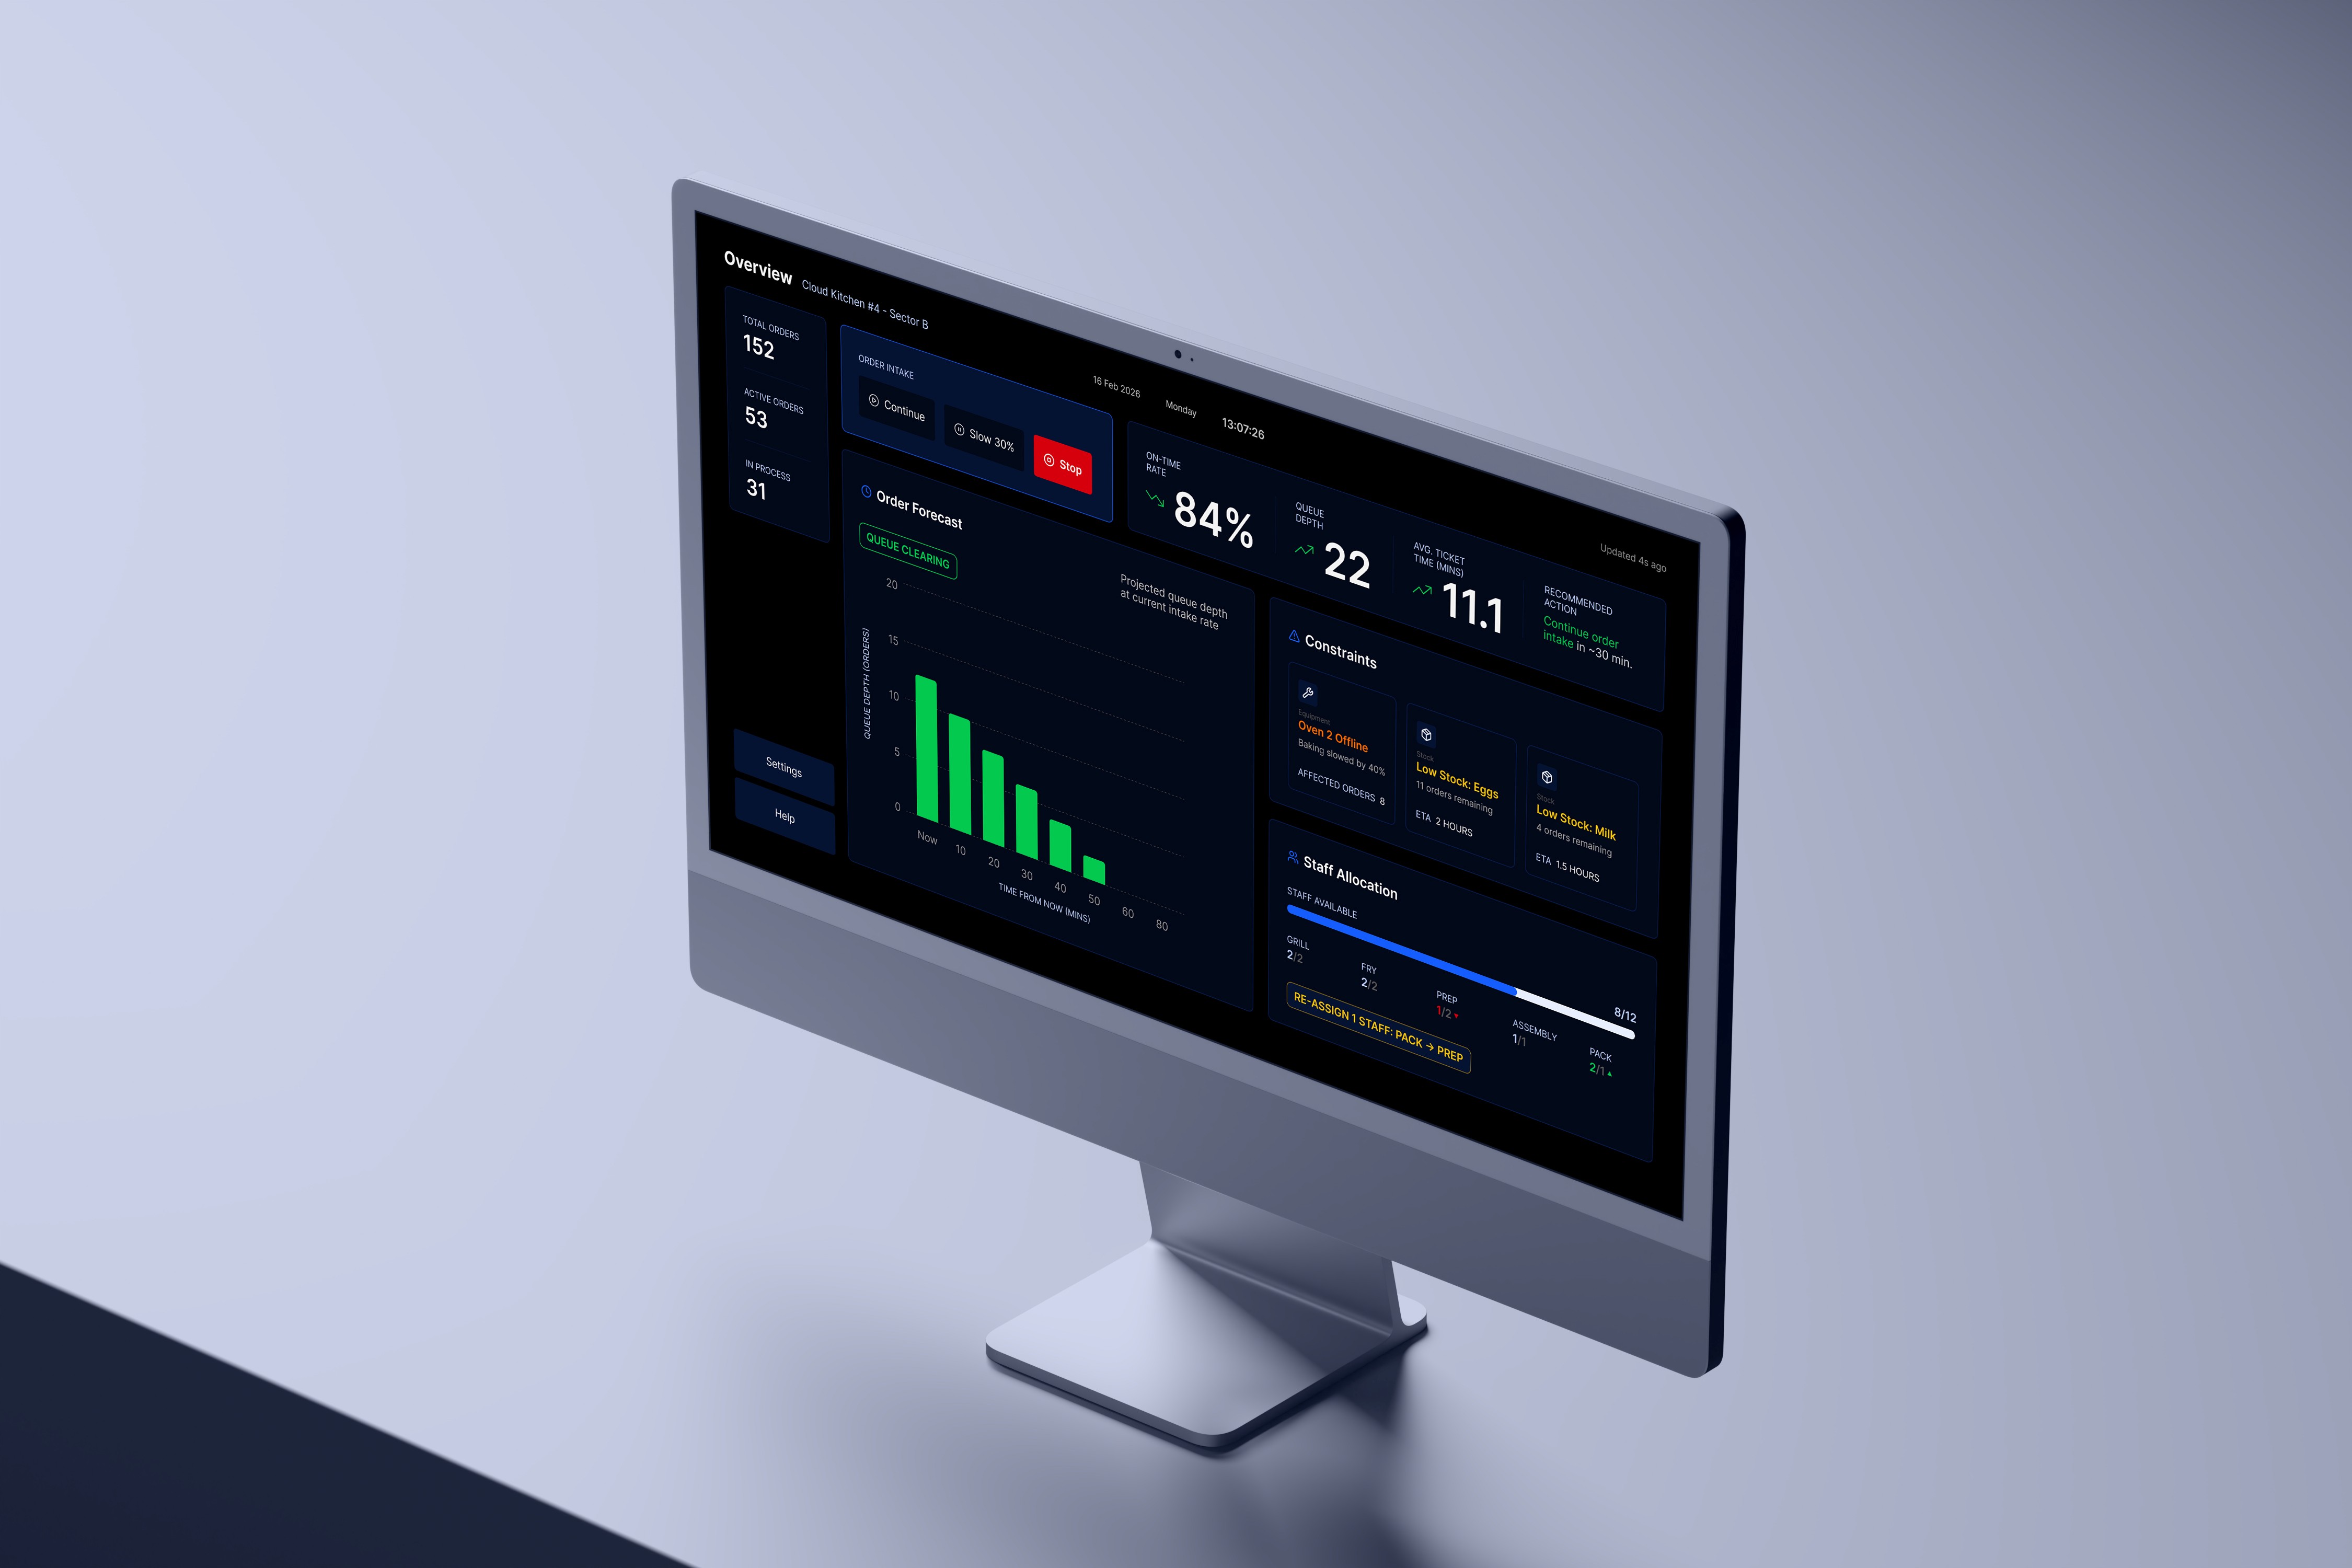
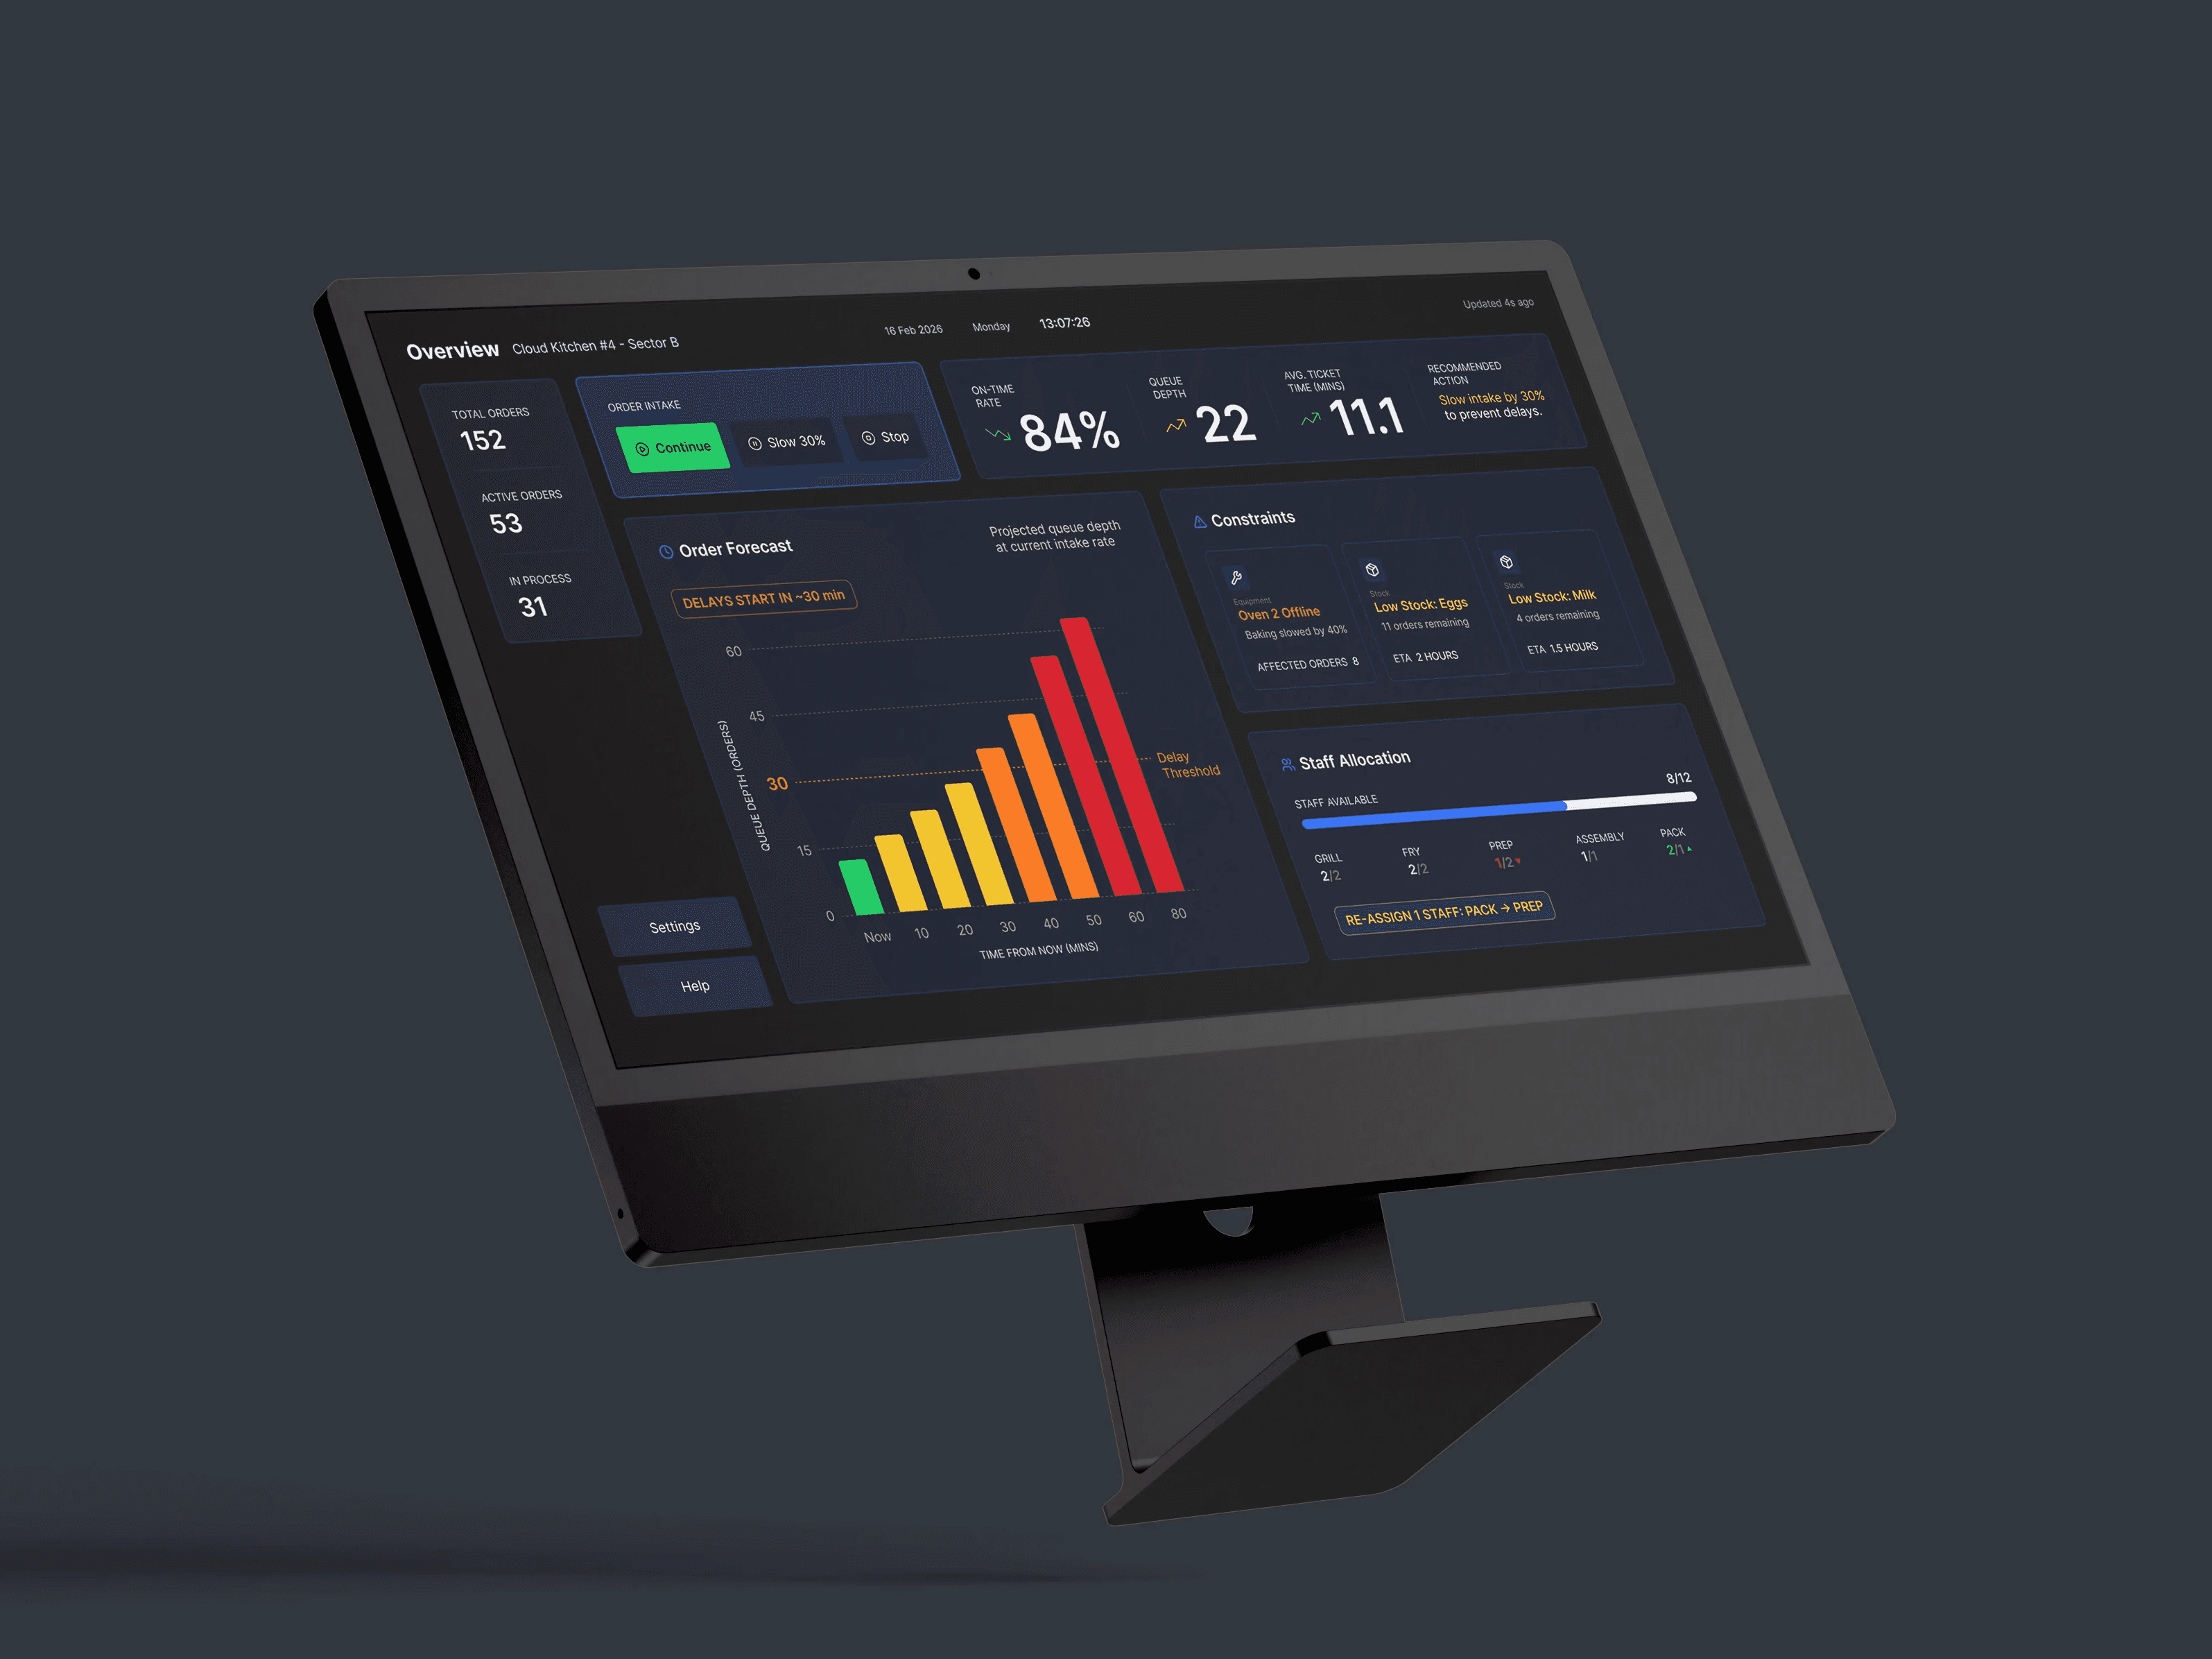
A unified, real-time dashboard that visualises performance, predicts risks and guides operators to take timely, informed action.
Final design